Our services are currently available to a limited number of customers in selected countries, get in contact to learn more.
Full shelf control.
In the blink of an AI.

06:30
AM
10:00
AM
13:30
PM
16:30
PM
19:00
PM

Spotimize captures your patisserie and bakery shelf performance.
Which products are on your shelves, what is mysteriously missing, and what is going to waste? Spotimize's in-store camera's captures your shelf status multiple times a day. Our AI analyzes these snapshots instantly, recognizing your specific baguettes, brownies, and eclairs. All these insight are summarized on your dashboard.

Shelf compliance?
Check.
Helloooooo realtime data!

06:30
AM
10:00
AM
13:30
PM
16:30
PM
19:00
PM
act on "sorry we are
sold out" frustrations.

Waste no more.
average: 32kg waste
today: 24kg waste


Impressively accurate AI image recognition
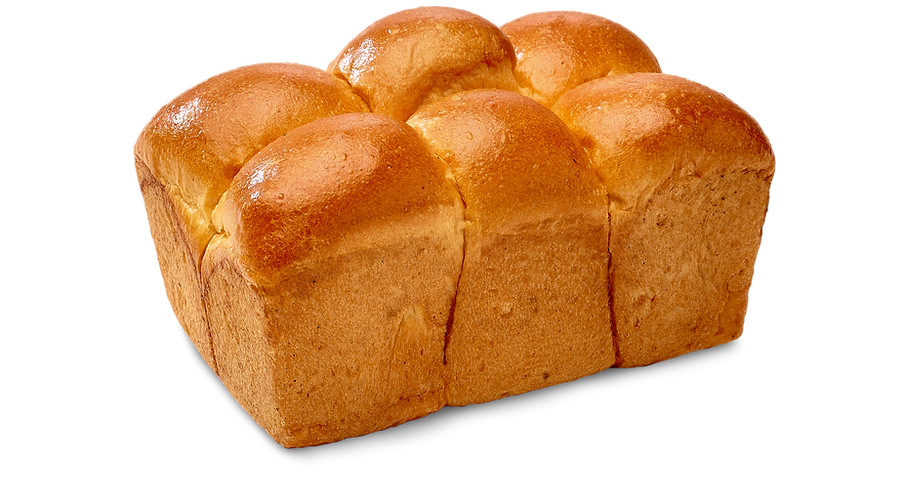
Spotimize uses in-store cameras to capture multiple times a day the latest status of your shelf’s performance. Our AI is trained to recognize your baguettes, brioche, sandwiches, brownies... you bake it, we spot it.
0035: vegetable wrap (120gr)
optimize shelf fill rates %
increase on-shelf availability %
minimize waste rates %
What’s on the shelf, mysteriously absent, and what’s sadly slipping into waste? It’s a combination of insights that empowers you to make sales-generating shelf moves, without the uncertainty of guesswork.
Shelf Fill Rate%
Measures the percentage of sum of facings vs. the max capacity of facings on the shelf.
Share of shelf%
The indicator of how much facings your products take in relation to the total sum of product facings.
Sum of facings
Total sum of goods that Spotimize sees.
On Shelf Availability %
Measures the percentage of sum of facings vs. the max capacity of facings on the shelf.
OOS frequency%
The sum of OOS devided by the number of measurments.
Total Out of Shelf
Sum of out-of-shelf occurences.
Waste Rate%
Measures the percentage of sum of facings vs. the max capacity of facings on the shelf.
Share of waste%
the indicator of how much facings your products take in relation to the total sum of product facings.
Sum of Waste
Measuredin Kg, and/or countof items.

